Measuring gender inequality at university using an Index. The case of the University of Bologna

Authors

Gian Piero Mignoli1, Benedetta Siboni2, Camilla Valentini1, Tullia Gallina Toschi3

1 Control and Finance Division, University of Bologna, Bologna, Italy

2 Department of Management, University of Bologna, Italy

3 Department of Agricultural and Food Sciences, University of Bologna, Bologna, Italy

Contact: Benedetta.siboni@unibo.it

Abstract

This case study applies the University Gender Inequality Index (UGII) to the University of Bologna (UNIBO) during the 2015-2018 period to investigate if and how gender balance has changed.

UGII is an index to measure gender inequality at university developed by a group of staff involved in the elaboration of the Gender Equality Annual Report at UNIBO (Mignoli et al., 2018). UGII builds on nine domains and 25 aspects measured by 25 indicators, considering academic staff, technical-administrative staff and students. Using index numbers, UGII aims to measure the distance between the situation of gender inequality performed by each university and the maximum level of inequality that can be recorded concerning each domain. Finally, by synthesising the index numbers calculated about each domain, the UGII provides a final score of the overall situation of inequality against women/men at the university, allowing comparisons among different time horizons.

The calculation of UGII at UNIBO shows an overall male advantage, varying from 16.5% in 2015 to 15.7% in 2018 of the theoretical maximum, and an overall female advantage almost stable at 2.6% during the same time horizon. The sum of the two advantages, being the summary UGII, indicates an overall gender disparity varying from 19.1% in 2015 to 18.3% in 2018 of the maximum possible. Notably, the analysis of female advantage in each domain and their issues suggests the idea that women obtain better results than men in education. Female advantage has been recorded concerning aspects such as: access to university at the first cycle degree; dropout rate at the end of the year; study abroad-outgoing mobility; awarding of credits; average marks on exams. On the contrary, male advantage refers principally to aspects related to access to second cycle degree, academic career and leadership positions.


Methodology

Taking up as its starting point the European report “She Figures” (EU, 2019) showing a strong disadvantage for women at university, UGII measures the gender inequality in binary terms (women-men). Thus, this index is built and proposed to identify a measure of the domains showing the current situation of inequality against women. This is the first step to find the causes that produce such inequality.

UGII develops over the following scheme (Mignoli et al., 2018):

–      the domains of analytical and individual issues in which the domains are divided

–      elementary variables and corresponding populations

–      elementary scores representative of the degree of inequality regarding each issue

–      the criterion with which to summarise the elementary scores through the final index.


Figure 1 shows the nine domains considered by the index. The domains are divided into six “endogenous”, in which the University can, in some way, work directly, and three “exogenous” (including the labour market of graduates), where the university system can only implement indirect actions. Table 1 indicates the issues taken into consideration for each domain (in total 25), reporting for each of them the results found for females and males as well as their data about UNIBO in 2018.

Elementary scores are indicated as the “percentage of the maximum possible inequality”, as its value varies from 0 to 100. It assumes the value “0” in the case of perfect gender equity, “100” in the case of maximum possible inequality between men and women; “between 0 and 100” indicating the higher the number, the greater the inequality.

The percentage of the maximum possible inequality is the ratio between the Cramér’s V index calculated for the actual data and the V index that would be obtained in the case of the highest possible gender inequality. Calculated for each aspect the percentage of the maximum possible inequality for male advantage, the measure of the overall inequality for male advantage is obtained through the average value of these individual inequalities (where, in cases of female advantage, the inequality with masculine advantage is set equal to zero). Likewise, we obtain the overall inequality for women. The UGII is then calculated as the sum of the two overall inequalities (for men and women); it assumes values between 0 (perfect gender balance on all aspects) and 100 (maximum inequity possible, regardless of the gender favoured in each aspect) (UNIBO, 2019, pp. 86/87).

Results

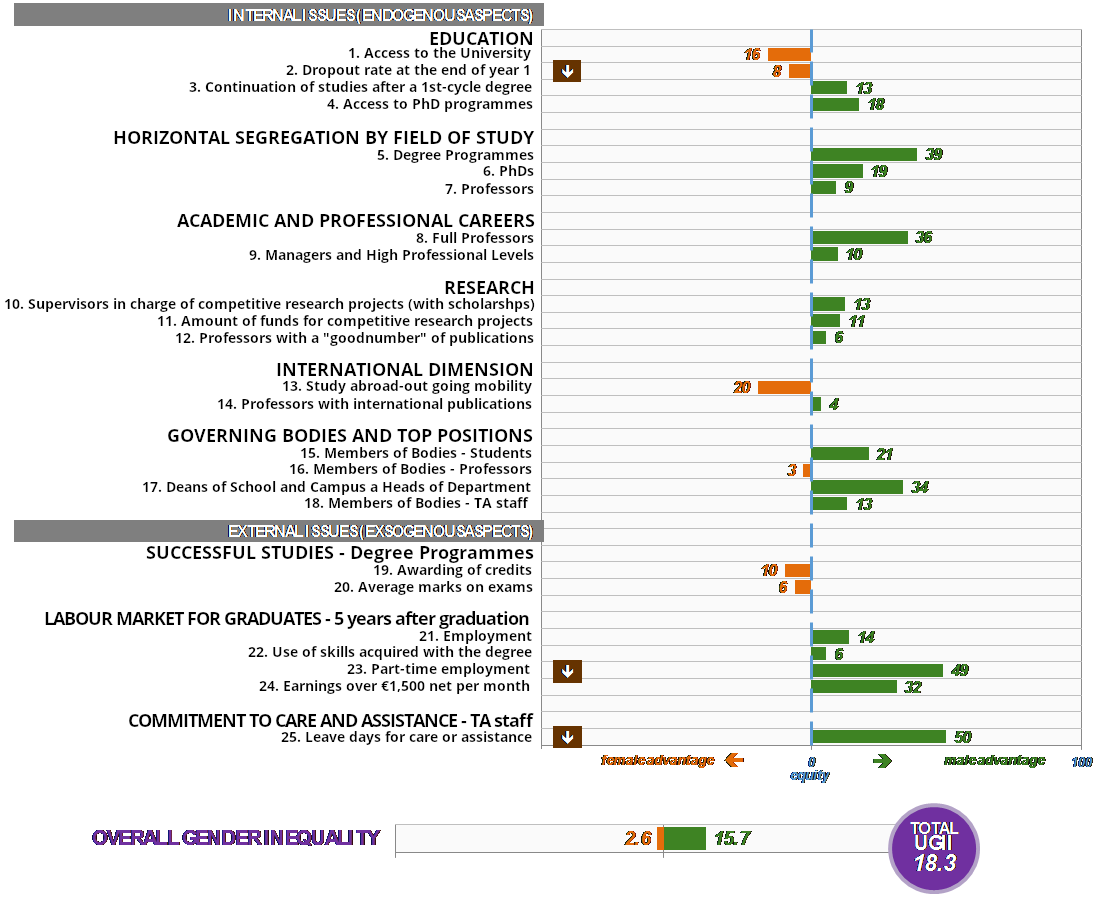
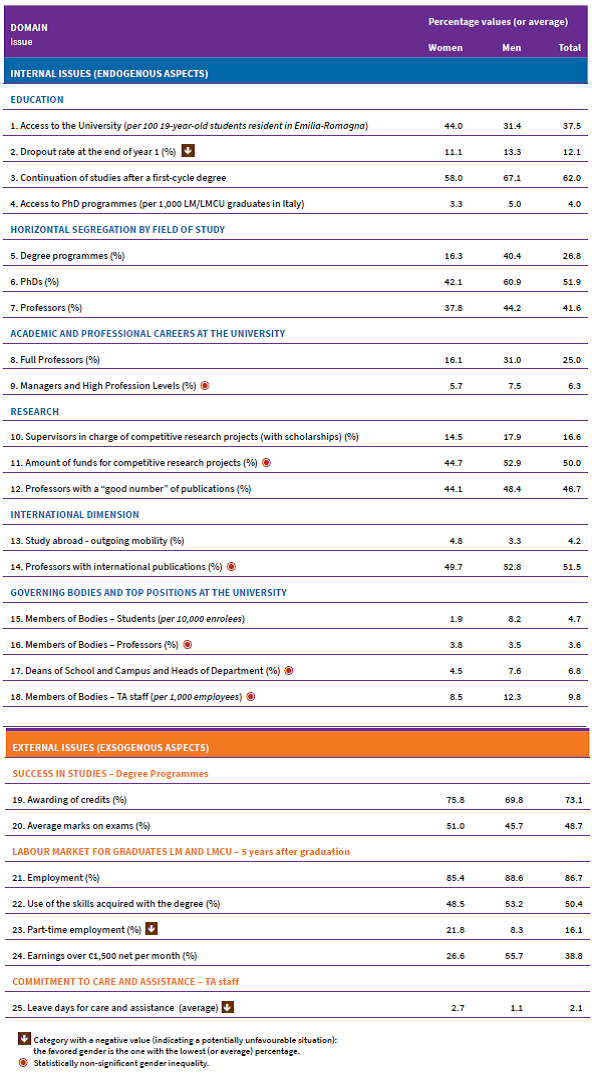
Figure 2 shows data for the 25 issues calculated at UNIBO in 2018, taken into consideration as the percentage of the maximum possible inequality. Notably, it emerges that women tend to invest more than men in the early stages of education: the number of matriculations as a percentage of nineteen-year-olds resident in the region is markedly higher for women than for men; female tend to abandon the degree programme less readily than men; they are more likely to regular acquisition of credits and their university exam scores, as well as take part more frequently to foreign study programmes. On the contrary, taking into consideration the second cycle degree, it emerges that male graduates move on more frequently than females from their first cycle to enrolment for a second-cycle degree programme and they are more likely to enrol for PhD programme.

Horizontal segregation – measured concerning the distinction between STEM/non-STEM students – clearly suggest the male advantage. Inequality by subject is also reported among PhD students and university professors, however to a less degree. Vertical segregation entitled in men’s favour is evident considering academic/professional careers at the university: in terms of full professors, 31% are among men and only 16% among women.

With reference to the TA staff, the presence of managers and employees in the high professional level category is higher for men, but the degree of inequality is rather limited (10% of the theoretical maximum). In the Research domain, gender differences are to the advantage of men, for the allocation of funded research projects, amount of funding, and publications by teachers.


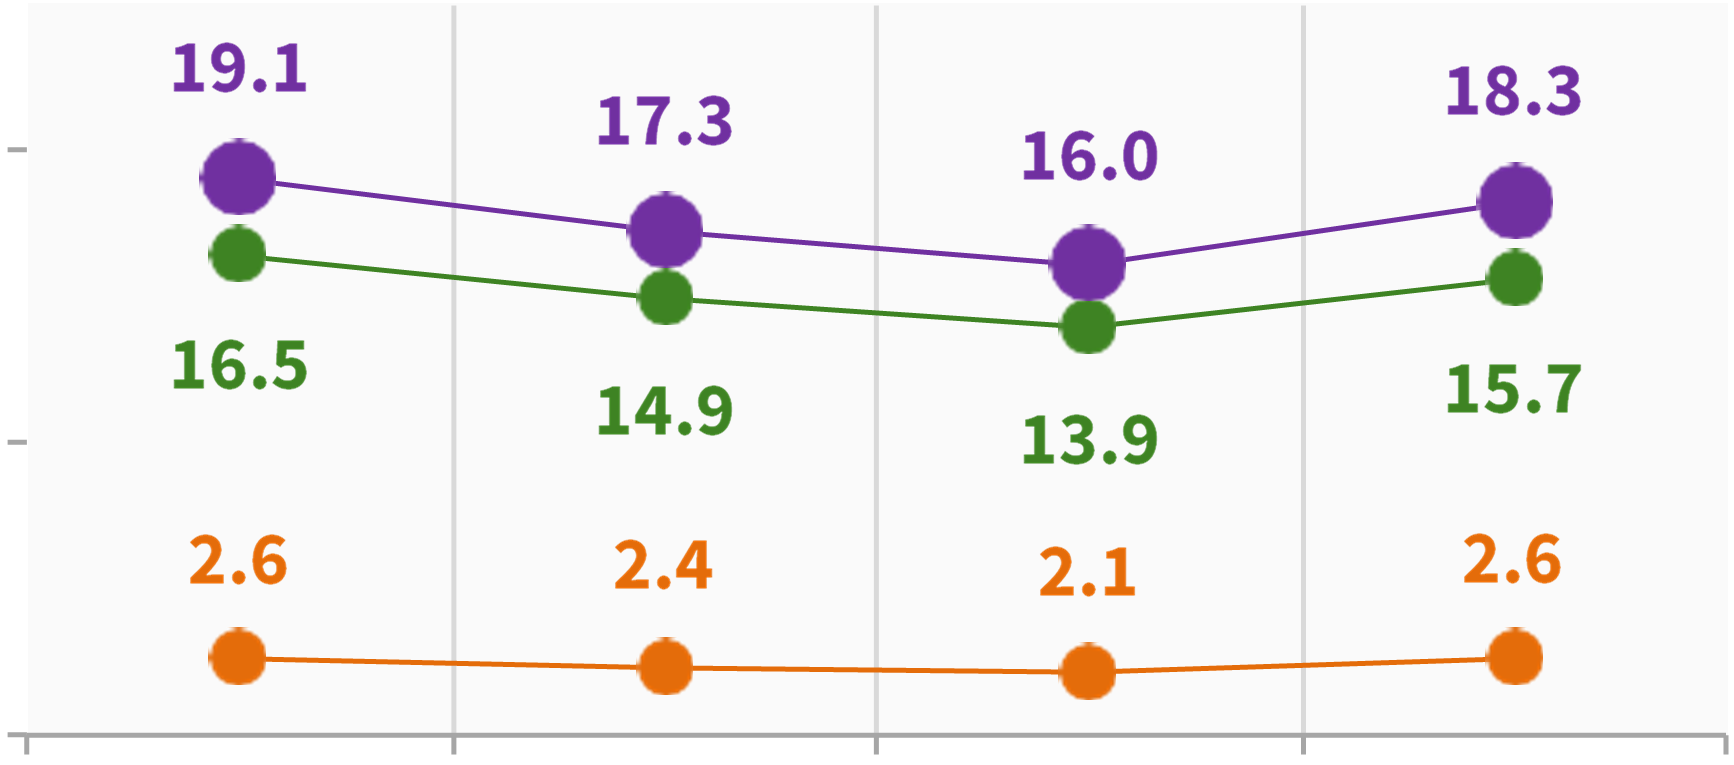
Considering the Academic Bodies and Executive Positions at UNIBO domain we can note that in 2018, in the Bodies in which students are admitted (Student Council, Academic Senate and Board of Governors) overall, there are 30 men and only nine women; this leads to a 59% inequality. This is a worrying fact, reflecting a common attitude among young generations, who tend to disregard the problem of gender inequality on the presumed basis that it has already been resolved. Since the gender ratio in 2017 was much more balanced (23 men against 18 women), this aspect contributes significantly to the change in the UGII index between 2017 and 2018.

Among professors, the gap involves leadership position such as School Presidents, Campus Presidents, and Head of Departments, while members of university bodies show a more balanced situation; but it is necessary to keep in mind that the total population of potential faculty members of university bodies is already predominantly male. Finally, gender inequality in men’s favour emerges also for technical administrative staff.

Thus, it can be concluded that, concerning the possibility of reaching positions of responsibility within the university, gender equality is still quite far away.

Conclusion

Figure 3 shows the time series for the last four years of the final score of UGII at UNIBO. On average, in 2018 results for the 18 endogenous issues considered in by UGII show that UNIBO has an overall male advantage equal to 15.7% of the theoretical maximum and an overall female advantage of 2.6%; the sum of the two advantages, being the summary UGII, indicates overall disparity of 18.3% of the maximum possible. This interrupts the downward trend in disparity that had lowered the UGII from 19.1% in 2015 to 16.0% in 2017.

To conclude, is UNIBO inequality 18% of the maximum possible value bearable? It is difficult to establish it, in the absence of terms of comparison towards other university and/or an average benchmark. However, if UGII is made available for the next few years for both Bologna and other universities, it will be possible to make comparisons between universities, check whether the current degree of inequality will continue to be reduced and disseminate the results. The same policies for achieving equal opportunities would gain in effectiveness.

Fact and figures


Figure 1. Domains for the analysis of gender inequality in UGII (Source: University of Bologna, Gender Equality Report 2018, p. 86.)


Figure 2. Gender Inequality at UNIBO (year 2018): % of maximum possible inequality (Source: University of Bologna, Gender Equality Report 2018, p. 90.)


Figure 3. Trend of UGII at UNIBO (2015-2018) (Source: University of Bologna, Gender Equality Report 2018, p. 97.)


Table 1. Gender Inequality at UNIBO: Domains and Issues (year 2018) (Source: University of Bologna, Gender Equality Report 2018, pp. 88-89.)

References

G. P. Mignoli, B. Siboni, P. Rignanese, C. Valentini, T. Gallina Toschi (2018), University Gender Inequality Index. A proposal from the University of Bologna, Working paper, submitted to OSF Preprints (DOI: 10.31219/osf.io/kfg6m)

EU – Directorate-General for Research and Innovation (2019), She Figures 2018. Gender in research and innovation. Statistics and indicators, European Commission, Brussels.

UNIBO – the University of Bologna, Gender Equality Report 2018, available at https://www.unibo.it/en/university/who-we-are/gender-budgeting/gender-equality-annual-report-2018